Indicadores
IME_distribution.RmdIndice de marginación a nivel municipal
library(ggplot2)
library(ggridges)
library(dplyr)
library(IM2020)
library(RColorBrewer)

data(IMM_2020)

IMM_2020 %>%
 ggplot() +
  geom_density_ridges(aes(x = IM_2020, y = NOM_ENT, fill = NOM_ENT, color = NOM_ENT),
                       alpha = 0.7,
                        rel_min_height = 0,
                         bandwidth = 1) +
   theme_ridges() +
    theme(plot.title = element_text(size = 12),
          plot.subtitle = element_text(size = 10),
          plot.margin = margin(t = 1, r = 0, b = 0, l = 0, "cm"),
          plot.caption = element_text(size = 8, hjust = -1, vjust = 5),
          axis.text.y = element_text(size = 8),
          axis.text.x = element_text(size = 6))  +
     scale_y_discrete(expand = c(0.05, 0)) +
      scale_fill_manual(values = colorRampPalette(brewer.pal(9, "PuBu"))(32)) +
       scale_color_manual(values = colorRampPalette(brewer.pal(9, "PuBu"))(32)) +
        guides(color = 'none', fill = 'none') +
         coord_cartesian(clip = "off") +
          labs(title = "Índice de marginación a nivel municipal, 2020",
               subtitle = "Desagregado por estados",
               x = "",
               y = "",
               caption = expression(paste("Fuentes: Estimaciones del CONAPO con base en el INEGI: Censo de Población y Vivienda 2020.")))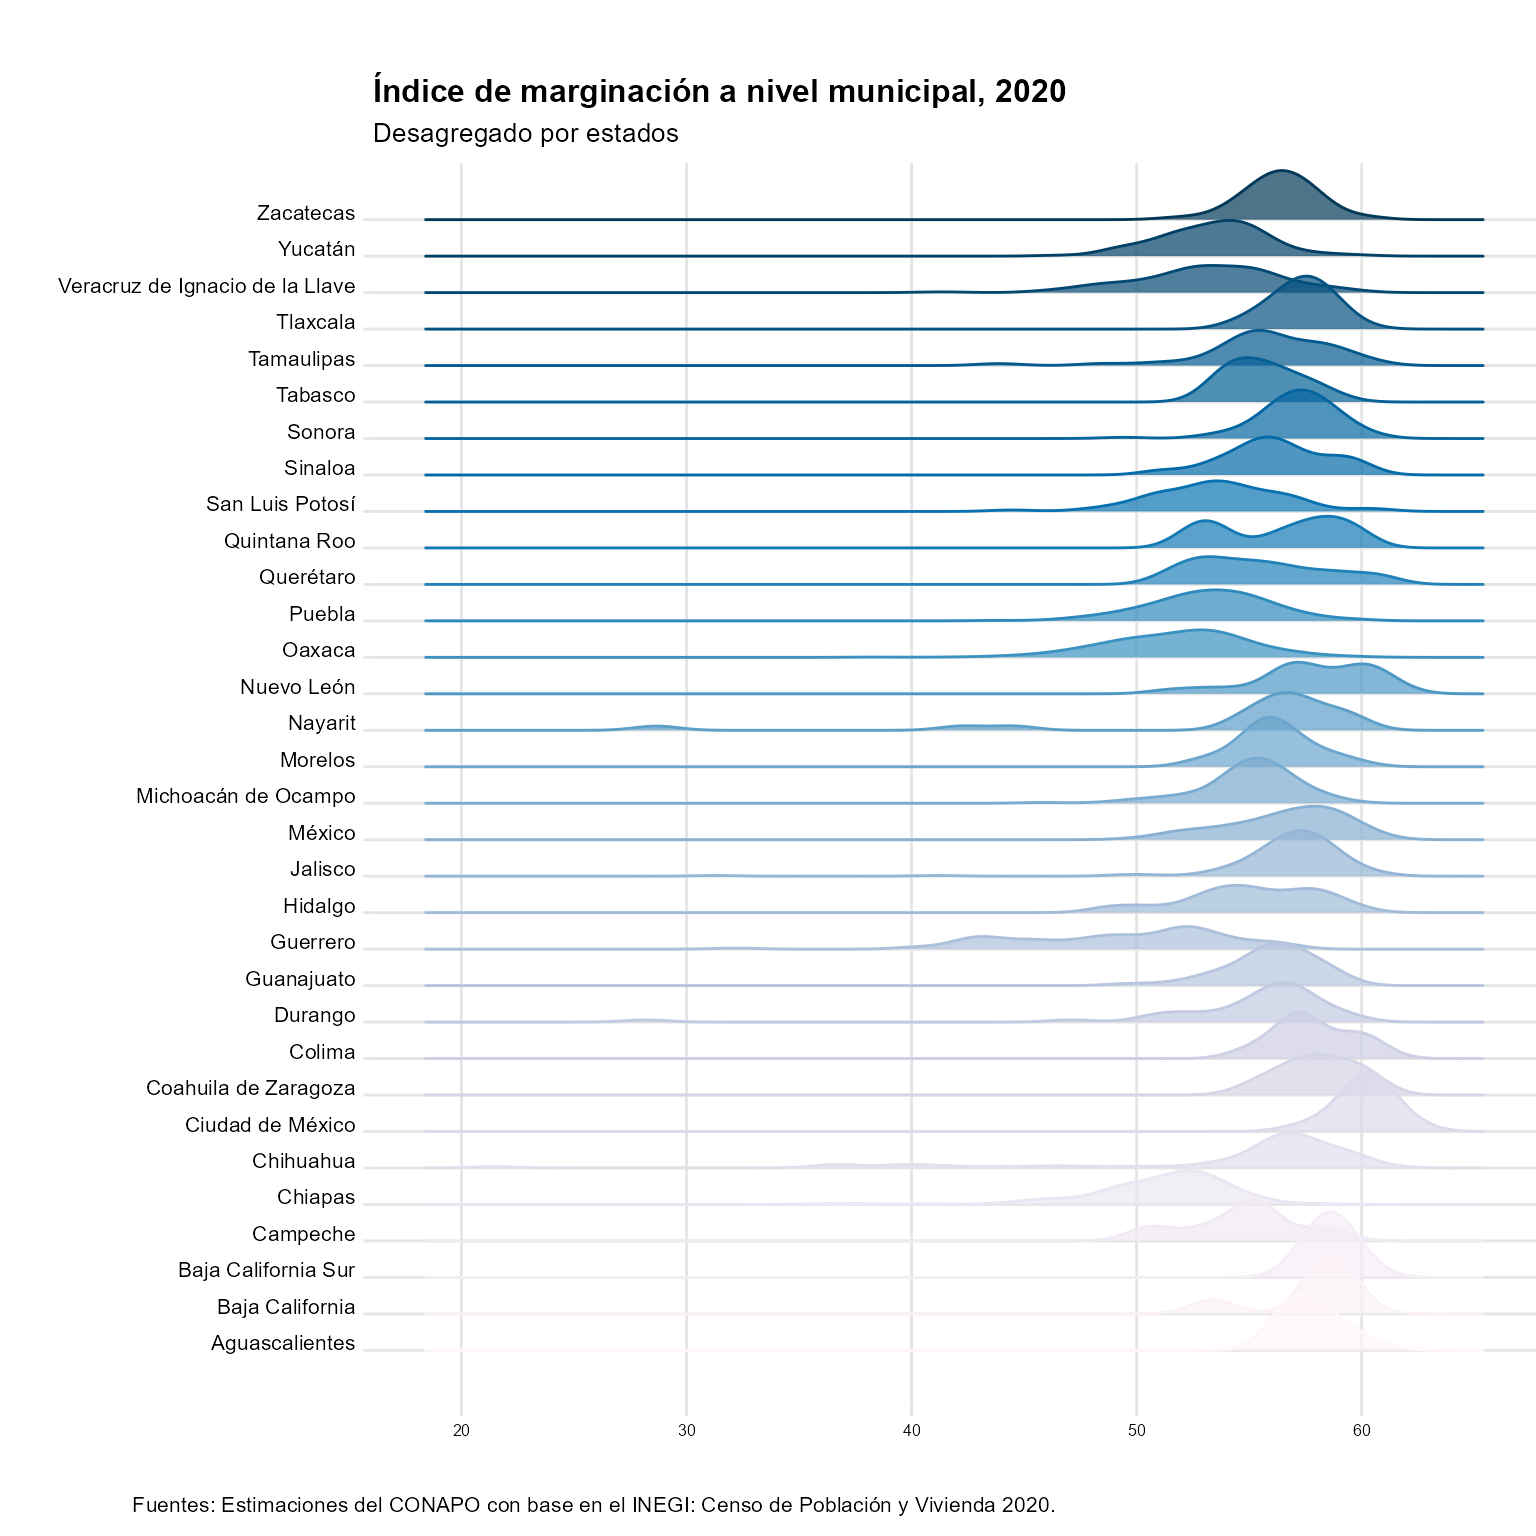
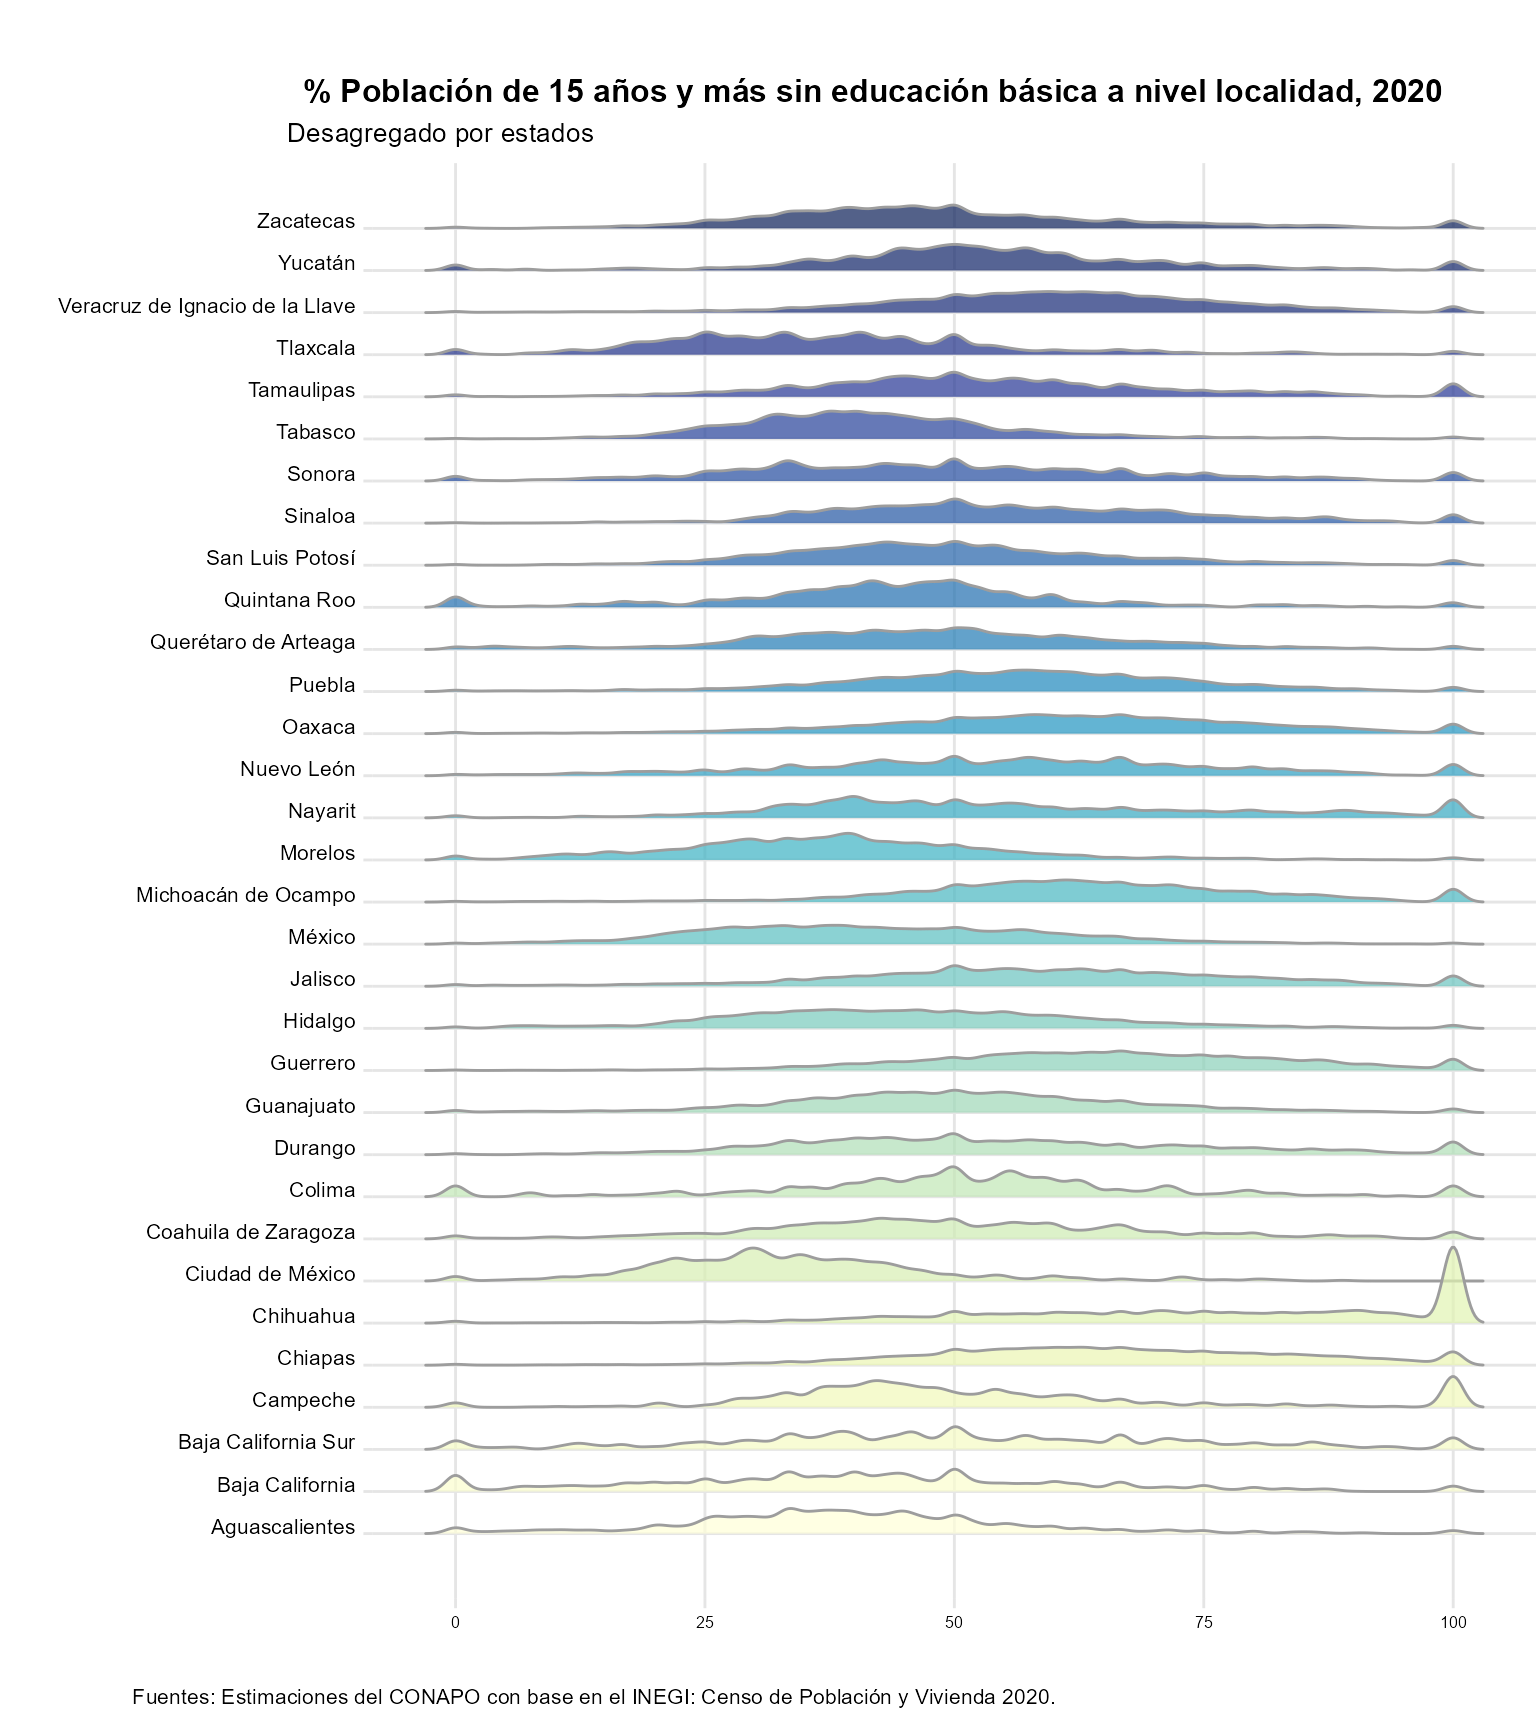
% Población de 15 años y más sin educación básica a nivel localidad
data(IML_2020)

IML_2020 %>%
 ggplot() +
  geom_density_ridges(aes(x = SBASC, y = NOM_ENT, fill = NOM_ENT),
                       color = "#9D9D9D",
                        alpha = 0.7,
                         rel_min_height = 0,
                          bandwidth = 1) +
   theme_ridges() +
    theme(plot.title = element_text(size = 12, hjust = -3),
          plot.subtitle = element_text(size = 10, hjust = -0.1),
          plot.margin = margin(t = 1, r = 0, b = 0, l = 0, "cm"),
          plot.caption = element_text(size = 8, hjust = -1, vjust = 5),
          axis.text.y = element_text(size = 8),
          axis.text.x = element_text(size = 6))  +
     scale_y_discrete(expand = c(0.05, 0)) +
      scale_fill_manual(values = colorRampPalette(brewer.pal(9, "YlGnBu"))(32)) +
       guides(color = 'none', fill = 'none') +
        coord_cartesian(clip = "off") +
         labs(title = "% Población de 15 años y más sin educación básica a nivel localidad, 2020",
              subtitle = "Desagregado por estados",
              x = "",
              y = "",
              caption = expression(paste("Fuentes: Estimaciones del CONAPO con base en el INEGI: Censo de Población y Vivienda 2020.")))